
Look Back Before You Pay Up
Price History Chart
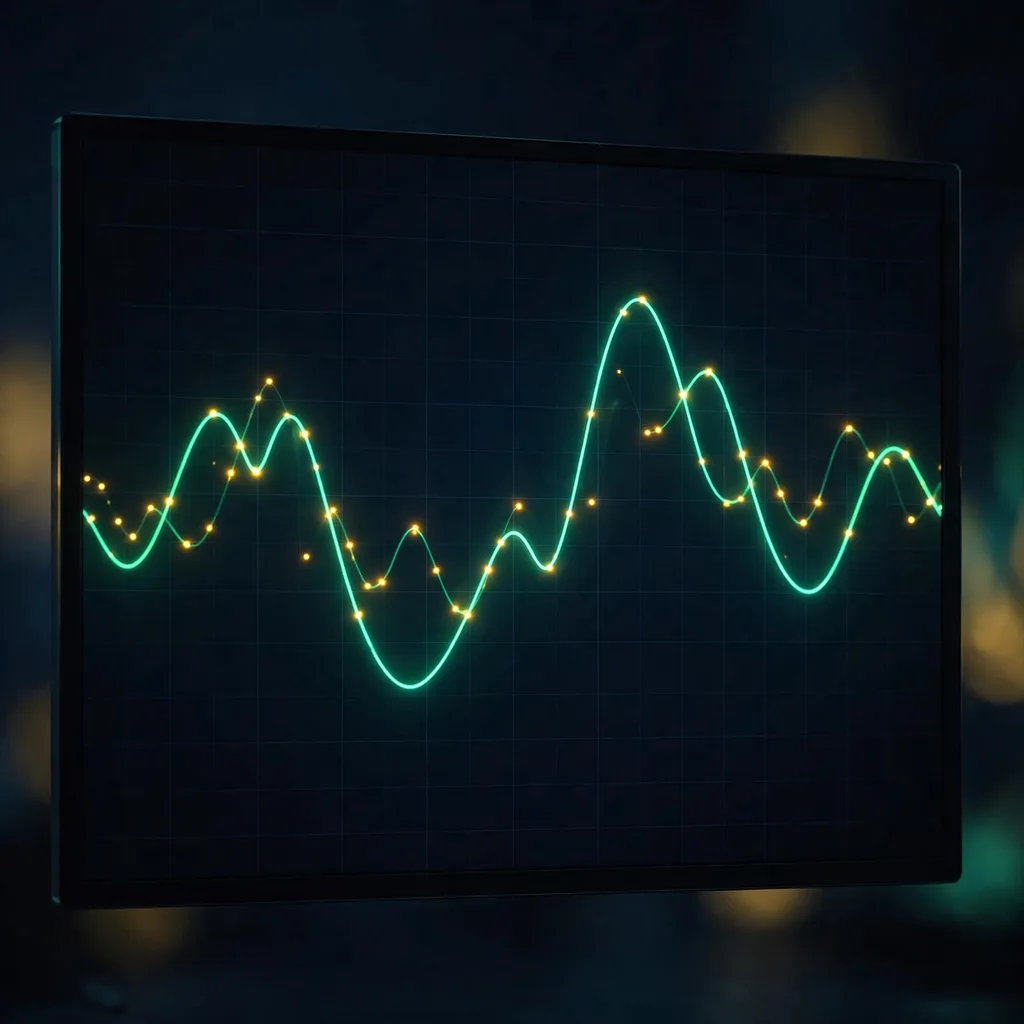
A real line chart of the dated prices you record, with the change, the range and how volatile the series is.
The series
Recorded points
No points yet. Record a dated price to draw the chart.
Formula
change     = latest − first
change %   = change ÷ first × 100
range      = highest − lowest
volatility = range ÷ average × 100
Example: four points running 8,000 / 8,600 / 8,300 / 9,100 is +1,100 (+13.8%), a range of 1,100 and volatility of about 13%.
Two readings is a difference, not a trend. Cosmetic markets are noisy, and a pattern needs far more points than most people give it.
//- 01 - HOW IT WORKS
HOW IT WORKS
- Pick an item. Choose the cosmetic you care about — the skin, charm or uniform you’re thinking of buying or selling.
- Read the history. Past reference values are laid out over time, so you can see the direction at a glance: climbing, sliding, or flat.
- Judge today’s number. Set the latest figure against the trend and the typical range before you decide whether it’s fair, steep, or a bargain.
//- 02 - HOW TO READ YOUR RESULT
HOW TO READ YOUR RESULT
- Direction beats precision. Whether a value is drifting up or down matters more than any single point — don’t obsess over one day’s figure.
- Spikes usually have a cause. Values jump around seasons, events and supply changes, then often settle. Buying at the top of a spike is how budgets die.
- Compare with the typical range. Example: an item that usually sits near 2,000 Credits but currently shows 3,500 is asking a premium — decide with that context, whatever you choose.
- History explains; it doesn’t predict. Past movement is background for a decision, never a guarantee about what happens next.
//- 03 - READING THE SHAPE OF A LINE
READING THE SHAPE OF A LINE

//- 04 - A WORKED EXAMPLE
A WORKED EXAMPLE

//- 05 - COMMON MISTAKES
COMMON MISTAKES
- Treating one point as “the price”. A single day’s figure is a sample, not a verdict. Judge it against the trend and the typical range, or you are just reading noise with confidence.
- Reading history as a forecast. The line records where values have been. It does not know about the next season, the next event or the next change in supply — and neither does anyone presenting it to you.
- Comparing lines across items. Two items’ histories are two different markets. A shape that means “settled” for a common charm says nothing about a scarce skin.
- Skipping the check on a small purchase. Peaks catch small budgets too. Thirty seconds of history costs nothing; overpaying at a spike costs the difference, every time.

//- 06 - GOOD TO KNOW
GOOD TO KNOW

//- 07 - FREQUENTLY ASKED QUESTIONS
Straight answers
Reading Price History
Is this the price the item sells for right now?
No. It’s a record of reference values over time. The only price that counts is the one in the Marketplace at the moment a trade actually fills.
What does a sharp spike in the line usually mean?
Usually a moment, not a new normal. Values jump around seasons, events and supply changes, then often settle — and the settle point after a spike matters more than the peak, because it is the market’s second, calmer opinion. Buying at the top of a spike is how budgets die.
Does a rising history mean the item will keep rising?
No. History explains; it does not predict. The line records where values have been and knows nothing about the next season, the next event or the next change in supply — treat it as background for a decision, never as a guarantee about what happens next.
How much history should I look at before deciding?
Enough to see the item’s typical range, not just its latest point. A long, settled stretch tells you where the item normally lives, and it is that range — not one day’s figure — that today’s price should be judged against.
Why is an item's history short or patchy?
Coverage depends on the reference data available for that item. A short history isn’t an error — some items simply have less recorded background than others.
Using History to Decide
How should I use price history before selling an item?
Compare the latest figure with the item’s typical range before you set your price: a level that has held for months is a calmer foundation than a recent spike. Remember, too, that the 10% seller fee comes out of whatever you sell for, so judge your expected proceeds after the fee, not before it.
Does an item's price history include the 10% fee?
No — the history tracks the item’s value, and the fee sits on top of that as a separate step. When a sale completes, the seller receives the sale price minus the 10% transaction fee; the buyer pays the matched price with no fee added.
How is this different from the Price History Chart in the Data section?
They’re companion views of the same idea — this page is the quick tool, the Data page presents it as a chart feature. Both are reference material, not live data.
Can I compare one item's history with another's?
You can look at both, but do not read them as the same story. Two items’ histories are two different markets — a shape that means “settled” for a common charm says nothing about a scarce skin, and each line only describes its own item.
Is this history live data from the Marketplace?
No. It is assembled from general reference data, because Ubisoft publishes no public price stream for the Marketplace — nothing here is a live quote or an official record. Ubisoft also currently lists the Marketplace as temporarily closed, which makes this a research tool for planning rather than a pre-trade check.
//- 08 - RELATED TOOLS
RELATED TOOLS
- Price History Chart — the chart presentation in the Data section
- Reading a Price — what the numbers on a listing actually mean
- Price Watchlist — save the item and set the price you’d pay